
Last reviewed: November 2026
If you live in Fort Worth, Plano, Frisco, Keller or anywhere else in DFW and North Texas, you have probably heard two stories about Texas power. One says the lights mostly stay on. The other says the grid is fragile. Both can be true at once, because they describe different kinds of days.
This guide separates them with public figures: the U.S. Energy Information Administration (EIA) numbers for every state, and the reliability figures that Oncor, the delivery utility for most of DFW, reports each year. It explains the measures in plain English, says why the Texas grid has had trouble, and says what the numbers can and cannot tell a homeowner.
The short answer: on an ordinary day, the average Texas customer was without power for 128.7 minutes in 2025, against 120.8 for the U.S. Oncor reported 78.1 minutes per customer outside significant storms. When major events are counted, the picture swings from year to year, and in 2024 Texas was well above the U.S. figure. None of these numbers predicts your next outage.
1. What the EIA measures, in plain English
Every year, electric utilities report to the EIA how often and for how long their customers lost power. The EIA combines the reports into three standard measures (EIA Table 11.3, checked November 13, 2026):
- SAIDI: the minutes of non-momentary interruptions the average customer had in a year. Think of it as total minutes without power.
- SAIFI: the number of non-momentary interruptions the average customer had in a year. Think of it as how many times the power went out.
- CAIDI: the average minutes it takes to restore an interruption. Think of it as how long a typical outage lasted.
SAIDI is an average across every customer, including those who had no outage. A year in which most homes lose power briefly and a few lose it for days can give the same SAIDI as a year in which every home loses it for an hour. The average hides the spread.
2. What counts as a “major event”
EIA publishes each measure twice, with all events and without major events. For utilities that follow the IEEE standard, a Major Event Day is a day whose SAIDI exceeds a threshold called Tmed, worked out from the past five years of daily values. Other utilities set their own rules, so the “without major events” line is not perfectly uniform from state to state. The EIA table says so itself.
In practice, a major event is a large storm or similar disruption. EIA’s article on 2024 names Hurricanes Beryl, Helene and Milton as examples (EIA, Today in Energy, December 1, 2025).
3. Ordinary days and major events: Texas against the U.S.
Without major events, the average Texas customer was without power for 128.7 minutes in 2025, against 120.8 for the U.S., a gap of 7.9 minutes (our arithmetic). Texas customers had slightly more interruptions (1.287 against 1.053), and each was restored somewhat faster (100 minutes against 114.7). In 2024 the totals were 129.4 and 126. The fair summary is “close to the national average”.
With major events included, two very different years sit side by side. In 2025, Texas averaged 223.5 minutes, below the U.S. figure of 262.6. In 2024, Texas averaged 1,270.6 minutes, roughly 21 hours, against 611.3 for the U.S. About 90 percent of that 2024 Texas total came from major events (our arithmetic). EIA notes that Hurricane Beryl left 2.6 million customers without power in Texas in July 2024. The full tables, with the share of customers covered, sit in one dated place: section 4 of the DFW hazard data hub.
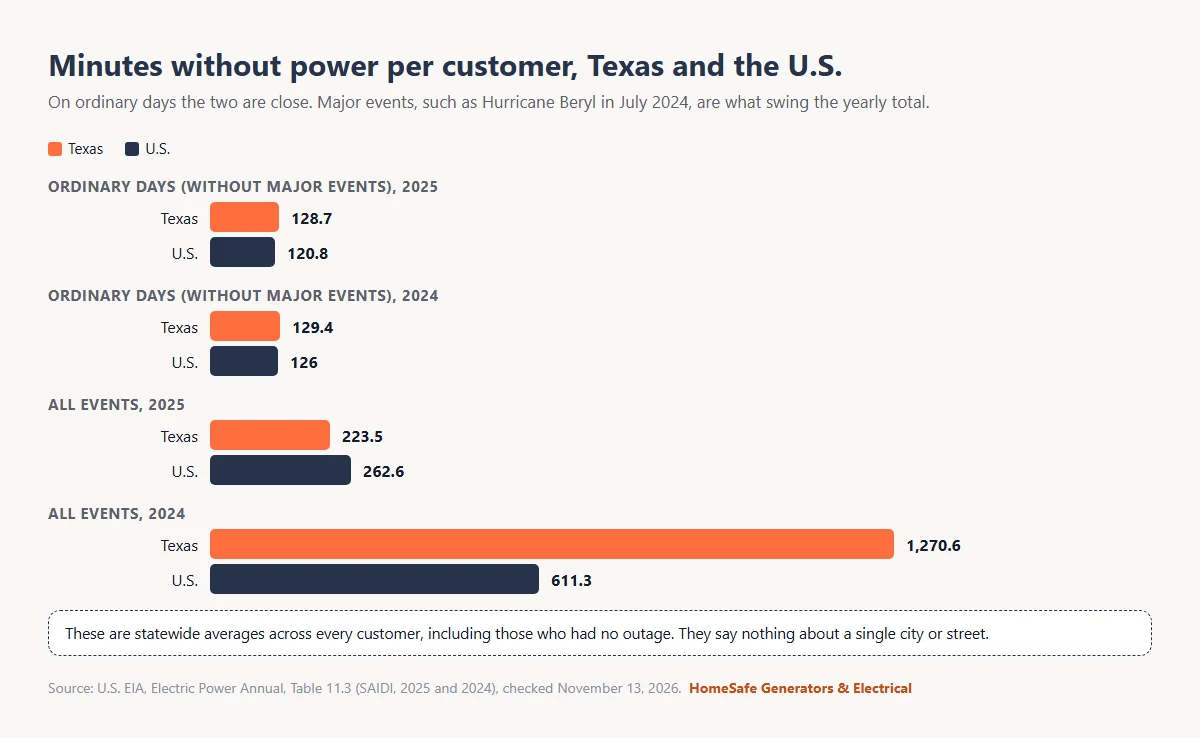
The lesson is not that big events are common. It is that they are rare, uneven and large enough to dominate a yearly average when they happen.
4. What the statewide figures can and cannot show
- They are statewide. Table 11.3 lists states, not utilities, cities or neighborhoods.
- They are averages. Your own history, your tree cover and whether your lines run overhead or underground matter more than any state figure.
- Coverage is not complete. The table covered 99.2 percent of Texas customers in 2025.
- They look backward. Two years of data say little about the next year.
5. What DFW’s own utility reports
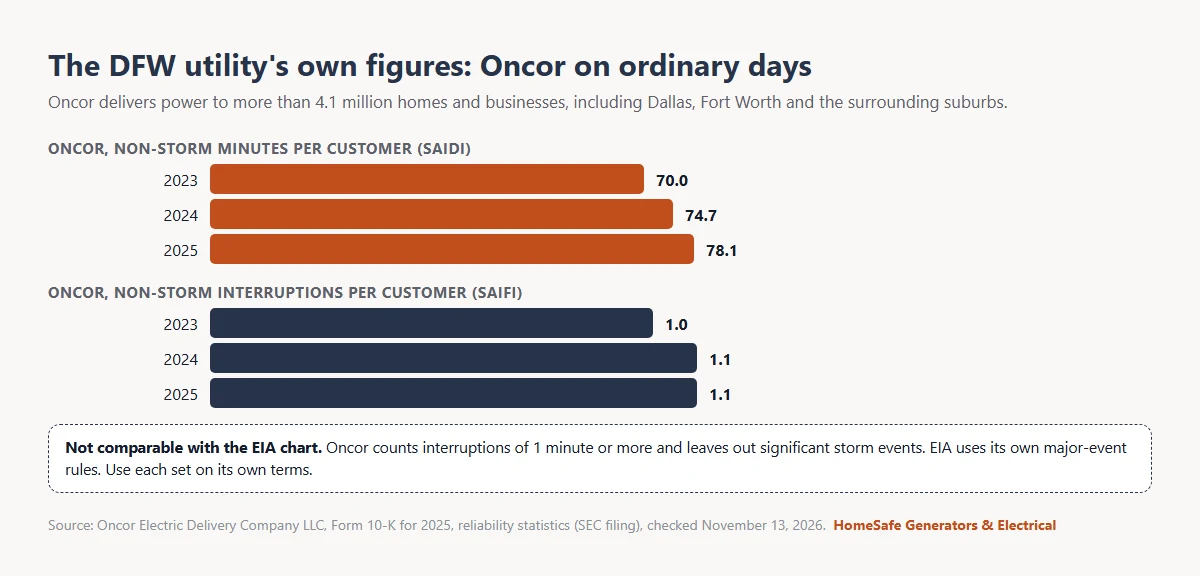
For a DFW view, Oncor’s own figures are the closest public record. Oncor delivers power to more than 4.1 million homes and businesses, in an area that includes Dallas, Fort Worth and the surrounding suburbs, in more than 120 Texas counties, Tarrant, Dallas, Collin and Denton among them. Its annual filing gives its reliability outside significant storm events (Oncor 2025 Form 10-K, checked November 13, 2026):
| Oncor, non-storm | 2023 | 2024 | 2025 |
|---|---|---|---|
| SAIDI (minutes per customer) | 70.0 | 74.7 | 78.1 |
| SAIFI (interruptions per customer) | 1.0 | 1.1 | 1.1 |
| CAIDI (minutes per interruption) | 70.7 | 69.8 | 70.4 |
Do not set these against the EIA chart. Oncor counts interruptions of 1 minute or more and leaves out significant storm events, and EIA uses its own rules. Read on their own terms, they say that on an ordinary year, the average Oncor customer has about one interruption, lasting a little over an hour. Some parts of DFW are served by an electric cooperative or a city-owned utility instead, and those publish their own figures.
6. Why the Texas grid works differently
The Electric Reliability Council of Texas (ERCOT) manages the grid for more than 27 million Texas customers, about 90 percent of the state’s electric load (ERCOT, About ERCOT, read November 13, 2026). Most of DFW is on it. Its ties to neighboring grids are limited: in an emergency, ERCOT says it can import up to 1,220 MW from them (ERCOT Grid Insight, December 2025). So when supply runs short, Texas leans mainly on its own power plants and on customers using less.
That is why ERCOT has a ladder of notices, from a Weather Watch to conservation requests to Energy Emergency Alerts. Controlled outages sit only at the top. The guide to ERCOT conservation appeals sets out each rung and its thresholds.
7. What happened in February 2021, briefly
The long outages people remember come from rare events like Winter Storm Uri. Federal staff who studied it found that more than 4.5 million people in Texas lost power, some for as long as four days (FERC, NERC and Regional Entity staff report, November 2021, checked November 13, 2026). ERCOT shed 20,000 MW of demand at the worst point to keep the system from a wider failure.
| Cause of generating unit outages, derates and failures to start | Share |
|---|---|
| Freezing issues | 44.2 percent |
| Fuel issues (mainly natural gas supply) | 31.4 percent |
| Other causes | 24.4 percent (our arithmetic) |
The dated DFW record of that week, with temperatures and hours below freezing, is in the list of DFW winter ice events.
8. Summer: tight days without outages
Summer brings the highest demand, and ERCOT’s requests to conserve usually come on hot evenings. The pattern on most tight days is a request, not an outage. On September 6, 2023, ERCOT issued a conservation appeal and then moved to EEA 2, and reported “no power outages associated with the ERCOT power grid” that evening (ERCOT release, read November 13, 2026). How often DFW reaches 100 degrees is in the guide to triple-digit days in DFW.
9. What has changed since 2021
The biggest change is a state rule. The Public Utility Commission of Texas now requires generation companies to complete winter weather preparation by December 1 each year and to file a declaration of winter preparedness with ERCOT (16 Texas Administrative Code §25.55, checked November 13, 2026). ERCOT then reports to the commission on who has filed.
Rules lower the risk; they cannot remove it. Storms on local lines are a separate matter: they are what Oncor’s storm figures leave out, and what the guides to storms and hurricane remnants and DFW seasons of risk cover.
10. What this means for your decision
The figures do not say your power will go out, and they do not say it will not. They give a calm baseline: ordinary-day reliability in Texas is near the U.S. average, and the long outages that stand out in memory come from rare, large events.
That baseline helps you ask the right question. It is not “is Texas power reliable?” but “how long could I be without it, and what would that do to my household?” For a home where an outage means a spoiled refrigerator, a hot house in July or a home office that cannot work, even a rare long outage can matter. For a household that can stay with a relative, or that has a prepared kit, it may matter much less. The readiness timeline sets out what to check before each season.
11. Where a standby generator fits, and where it does not
A standby generator suits homes where a long outage would be hard to absorb: you work from home, you have a large refrigerator and freezer load to protect, or you want the house to keep running without any action from you. It starts automatically when the power fails. If someone relies on powered medical equipment, that backup needs a job-specific review before any plan is made.
It is not the only answer, and for some homes it is more than needed. If outages where you live are short, a portable generator, a power bank and a cooler may be enough. A battery kit may cover a few essential circuits. Some homes need nothing beyond a prepared kit and a plan. The sizing planner shows how size follows the loads you choose, and the worth-it guide sets out both sides.
A free in-home assessment ends in a straight recommendation, and if a smaller system covers the need, we say so. How it works explains each step, and if an installed unit ever fails in an outage, generator service during a storm explains what to do. This guide covers power reliability for homes; it does not cover electricity plans, prices or commercial sites.
In this series: the DFW hazard data hub · seasons of risk in DFW · triple-digit days in DFW · DFW winter ice events · storms and hurricane remnants · ERCOT conservation appeals · the seasonal readiness timeline
Quick answers
How reliable is the Texas power grid?
Close to the U.S. average on ordinary days. EIA figures put the average Texas customer at 128.7 minutes without power in 2025, against 120.8 for the U.S. Oncor, the main DFW utility, reported 78.1 non-storm minutes. Major events change the yearly total: Texas was below the U.S. in 2025 and well above it in 2024.
Why does Texas have power grid issues?
Two reasons stand out. ERCOT’s ties to other grids are limited, with up to 1,220 MW of emergency imports, so Texas relies mainly on its own plants. And in February 2021, 75 percent of generating unit problems came from freezing or fuel supply, according to the FERC and NERC staff report.
Is the Texas power grid fixed?
No grid is risk-free, but rules have changed. Since 2021 the Public Utility Commission of Texas has required generation companies to finish winter preparation by December 1 each year and declare it to ERCOT. In 2025, ordinary-day outage minutes in Texas were close to the U.S. average.
Which state has the most reliable power grid?
No single state holds the title every year. In 2024, EIA reported that customers in Arizona, South Dakota, North Dakota and Massachusetts averaged less than 2 hours of interruptions, while the U.S. average was 11 hours, 80 percent of it from major events such as hurricanes.
Does ERCOT cover all of Texas?
No. ERCOT serves more than 27 million customers, about 90 percent of the state’s electric load. Most of DFW is on the ERCOT grid.
Do Fort Worth homes need backup power?
Not all of them. Ordinary-day outages in Texas are close to the U.S. average, and Oncor’s customers average about one non-storm interruption a year. Backup makes sense where a rare long outage would be hard to absorb, such as a home office, a large freezer load or someone who needs heat or cooling.
For a free in-home assessment, contact HomeSafe or call (817) 439-9009. HomeSafe holds Texas Electrical Contractor License #41809 and has a 5.0 rating across 200+ Google reviews, which you can read on the reviews page.
Sources
Percentages and differences marked “our arithmetic” are calculated from the sources.
- U.S. EIA, Electric Power Annual, Table 11.3 (2025 and 2024): https://www.eia.gov/electricity/annual/html/epa_11_03.html
- U.S. EIA, Today in Energy, “Hurricanes in 2024 led to the most hours without power in the United States in 10 years” (December 1, 2025): https://www.eia.gov/todayinenergy/detail.php?id=66744
- Oncor Electric Delivery Company LLC, Form 10-K for 2025 (SEC): https://www.sec.gov/Archives/edgar/data/1193311/000119331126000007/c311-20251231x10k.htm
- ERCOT, About ERCOT: https://www.ercot.com/about
- ERCOT, Grid Insight: Grid Conditions Notifications (December 2025): https://www.ercot.com/files/docs/2025/12/17/ERCOT-Grid-Insight-Grid-Conditions-Notifications.pdf
- ERCOT news release, EEA Level 2 (September 6, 2023): https://www.ercot.com/news/release/2023-09-06-ercot-has-initiated
- FERC, NERC and Regional Entity Staff Report, The February 2021 Cold Weather Outages in Texas and the South Central United States (November 2021): https://nerc.com/pa/rrm/ea/Documents/February_2021_Cold_Weather_Report.pdf
- 16 Texas Administrative Code §25.55, Weather Emergency Preparedness: https://www.law.cornell.edu/regulations/texas/16-Tex-Admin-Code-SS-25-55