
Last reviewed: November 2026
Homeowners in Fort Worth, Plano, Frisco, Keller, Southlake and Colleyville keep asking versions of the same question: how often do storms, heat and power outages actually happen here? The public answers exist, but they sit on different agency websites, in different formats, with different dates. This page puts the figures in one place, each with its source and a link.
It is a reference page, not an argument. A count of past events does not say whether an event will reach your home. Use the tables to check claims you read elsewhere, including ours. The other guides in this series link here rather than reprint these tables, so this is the one place they are kept up to date.
The short answer: tornado records in North and Central Texas peak in April and May. A normal year at DFW has about 20 days at or above 100 degrees, and the hottest years have run to between 44 and 71. On ordinary days, Texas outage time is close to the U.S. figure; a few large events drive the differences between years.
When HomeSafe visits a home in Tarrant, Dallas, Collin or Denton County, these figures are background. The recommendation itself comes from your panel, your gas supply and the loads you want to keep running.
1. How to use this page
Each table names its source, the years it covers and a link. Anything we calculated ourselves is labelled as our arithmetic.
Two cautions apply throughout. The tornado counts cover North and Central Texas, the area served by the National Weather Service (NWS) Fort Worth office, which is larger than the DFW metro. The outage figures are statewide. Neither describes a single street or utility.
2. Tornado counts by month, North and Central Texas
Source: NWS Fort Worth, North and Central Texas tornado statistics. Table period: 1950 to 2025. Page date: “Updated Through 5/15/2026”.
| Month | Tornadoes recorded, 1950 to 2025 |
|---|---|
| January | 45 |
| February | 33 |
| March | 215 |
| April | 555 |
| May | 525 |
| June | 154 |
| July | 26 |
| August | 41 |
| September | 65 |
| October | 145 |
| November | 58 |
| December | 91 |
| Total, 1950 to 2025 | 1,953 |
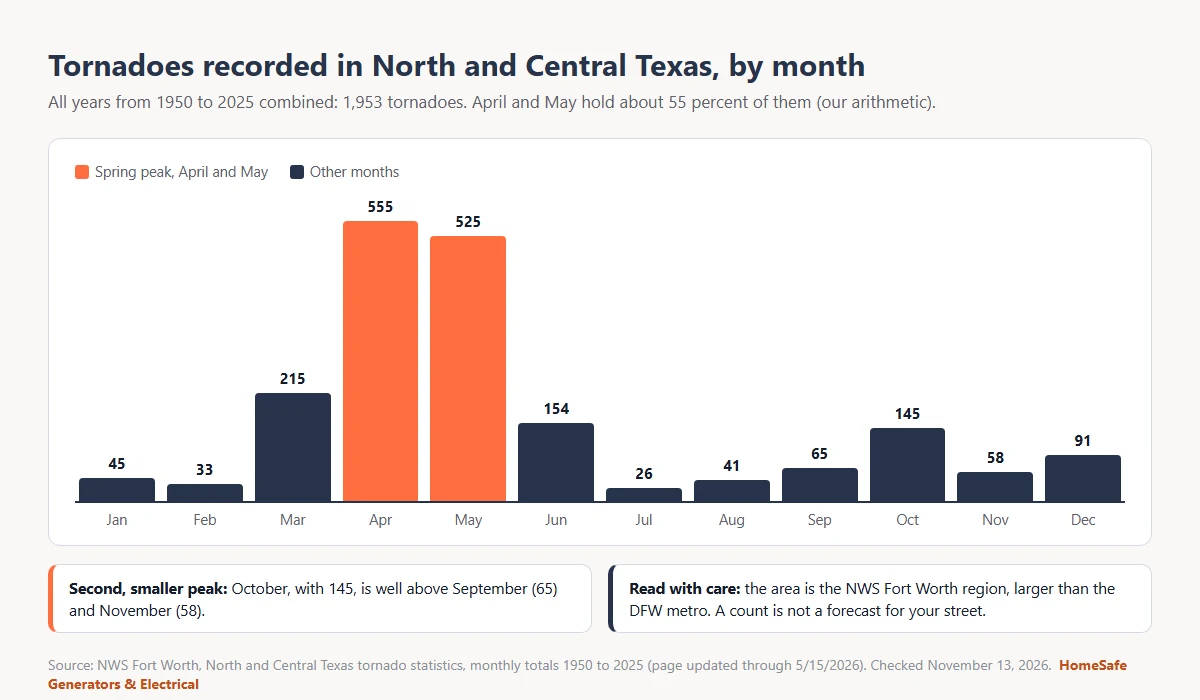
What the table shows: April and May together hold 1,080 of the 1,953 recorded tornadoes, about 55 percent (our arithmetic). October, at 145, is a smaller second peak. Across all 76 years the average is about 26 a year (our arithmetic), but single years vary widely: the same NWS page lists 76 in 2015 and 12 in 2018.
What it does not show: how many reached a home, how many caused an outage, or what the next season will bring. For what each month looks like through the year, see the seasons of risk calendar.
3. Hottest years by days at or above 100 degrees, DFW
Source: NWS Fort Worth, Greatest annual 100 degree days at DFW. Page date: last updated 9/22/2026.
| Rank | Days at or above 100 degrees | Year |
|---|---|---|
| 1 | 71 | 2011 |
| 2 | 69 | 1980 |
| 3 | 56 | 1998 |
| 4 | 55 | 2023 |
| 5 (tie) | 52 | 2026 (provisional) |
| 5 (tie) | 52 | 1954 |
| 7 | 48 | 1956 |
| 8 | 47 | 2022 |
| 9 | 46 | 2000 |
| 10 | 44 | 1952 |

For a normal year, the NWS Fort Worth 1991 to 2020 normals give DFW an average of 20 days a year at or above 100 degrees, 2 more than the 1981 to 2010 normals. The NWS DFW 100-degree facts page puts the average first 100-degree day on July 1 and the average last on August 27.
The 2026 entry is provisional. NWS says the 2026 ranking “is subject to change through the end of the warm season,” so check the NWS page for the final count before quoting it. The count is for one reporting point, DFW, and says nothing about conditions in Denton, Arlington or Weatherford. The triple-digit days guide explains what the list does and does not show.
4. Outage minutes and interruptions, Texas and the U.S.
Source: U.S. Energy Information Administration (EIA), Electric Power Annual, Table 11.3, reliability metrics by state, data years 2025 and 2024. Data source: Form EIA-861.
SAIDI is the minutes without power per customer in a year. SAIFI is the number of interruptions per customer in a year. CAIDI is the average minutes to restore each interruption.
Without major events, data years 2025 and 2024
| Measure | Texas 2025 | U.S. 2025 | Texas 2024 | U.S. 2024 |
|---|---|---|---|---|
| SAIDI (minutes) | 128.7 | 120.8 | 129.4 | 126 |
| SAIFI (interruptions) | 1.287 | 1.053 | 1.218 | 1.043 |
| CAIDI (minutes) | 100 | 114.7 | 106.2 | 120.8 |
With all events, major events included, data years 2025 and 2024
| Measure | Texas 2025 | U.S. 2025 | Texas 2024 | U.S. 2024 |
|---|---|---|---|---|
| SAIDI (minutes) | 223.5 | 262.6 | 1,270.6 | 611.3 |
| SAIFI (interruptions) | 1.704 | 1.338 | 2.114 | 1.521 |
| CAIDI (minutes) | 131.2 | 196.3 | 600.9 | 401.9 |
Share of customers covered by the metrics
| 2025 | 2024 | |
|---|---|---|
| Texas | 99.2% | 98.1% |
| U.S. total | 94.7% | 95.0% |
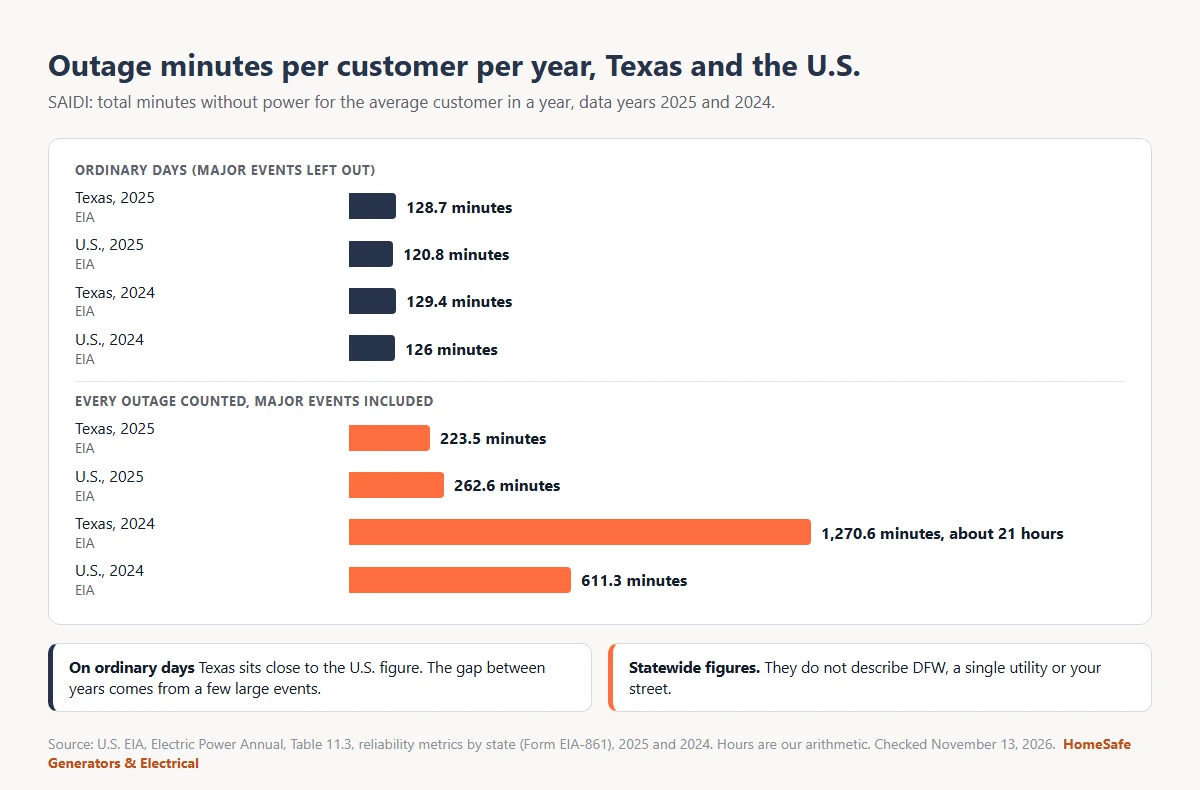
For utilities following the IEEE method, a major event day is one that exceeds a daily SAIDI threshold called Tmed; for other utilities, the reporting utility decides what counts as a major event. The table is by state and does not list utilities or cities.
For a DFW utility view, Oncor, which is based in Dallas and delivers electricity to more than 4.0 million homes and businesses, reported a non-storm SAIFI of 1.1 and a non-storm CAIDI of 69.8 minutes for 2024. Those figures exclude outages during significant storm events (Oncor 2024 Corporate Sustainability Report, page 6). The guide to Texas grid reliability walks through what ordinary days and major events mean in plain English, and the piece on ERCOT conservation appeals explains the grid-wide requests you may see on hot or cold days.
5. What these figures mean for your home
These tables describe the region and the state. They do not say your power will fail, and they do not say it will not. They help you judge how loud the claims you read are, including the ones about storms and hurricane remnants and winter ice events in DFW.
A standby generator suits homes where a long outage would be hard to absorb: you work from home, a hot house is a real problem, or someone uses powered medical equipment (backup for medical equipment is job specific and needs a job-specific review before any system is planned). For many homes, a portable unit, a battery kit or a prepared kit is enough, and the seasonal readiness timeline covers the kit.
If you are weighing a permanent system, the sizing planner shows how size follows the loads you choose, and the worth-it guide covers both sides. When you want a recommendation for your own home, standby generator installation starts with a free in-home assessment of the panel, the gas supply and the places a unit could go. If a smaller system covers what you need, HomeSafe says so.
Sources
All checked November 13, 2026.
- NWS Fort Worth, North and Central Texas tornado statistics (monthly totals and yearly totals, 1950 to 2025; updated through 5/15/2026): weather.gov/fwd/fwdtornadoes
- NWS Fort Worth, Greatest annual 100 degree days at DFW (updated 9/22/2026; 2026 provisional): weather.gov/fwd/danncon10
- NWS Fort Worth, 1991 to 2020 normals (100-degree days per year at DFW): weather.gov/fwd/1991-2020_normals
- NWS Fort Worth, DFW 100 degree day facts (average first and last 100-degree dates): weather.gov/fwd/d100info
- U.S. EIA, Electric Power Annual, Table 11.3 (2025 and 2024): eia.gov, Table 11.3
- Oncor, 2024 Corporate Sustainability Report, pages 4 and 6: oncor.com
In this series: seasons of risk in DFW · triple-digit days in DFW · DFW winter ice events · storms and hurricane remnants · Texas grid reliability · ERCOT conservation appeals · the seasonal readiness timeline
Quick answers
How common are power outages in Texas?
About 1.3 a year for the average customer on ordinary days. EIA data for 2025 show 1.287 interruptions per customer in Texas without major events, against 1.053 for the U.S. With major events included, the Texas figure was 1.704. These are statewide averages, not figures for your street.
Does Dallas have power outages?
Yes, though on ordinary days they are usually short. Oncor, which is based in Dallas, reported 1.1 interruptions per customer in 2024 outside significant storms, averaging 69.8 minutes each. Storms add to those figures.
Why does Texas have so many blackouts?
On ordinary days it has only a few more than the national average. EIA data for 2025 show 128.7 outage minutes per customer in Texas without major events, against 120.8 for the U.S. The big differences come from a few large events: with them included, Texas recorded 1,270.6 minutes in 2024, against 611.3 for the U.S.
What month does Texas get the most tornadoes?
April, in the North and Central Texas records. NWS Fort Worth counts 555 tornadoes in April and 525 in May from 1950 to 2025, followed by March with 215 and October with 145.
How often do tornadoes hit Dallas?
About 26 a year across North and Central Texas, on the 1950 to 2025 average (our arithmetic from NWS Fort Worth’s 1,953 recorded tornadoes). That region is much larger than Dallas, and yearly counts swing widely, from 12 in 2018 to 76 in 2015.
Which year had the most 100-degree days at DFW?
2011, with 71 days. NWS Fort Worth lists 1980 second with 69, then 1998 with 56 and 2023 with 55. A normal year has about 20.
Do these figures mean I need a standby generator?
No. They are background. A standby generator suits homes that could not absorb a long outage, and a portable unit, a battery kit or a prepared kit may be enough for others.
For a free in-home assessment, contact HomeSafe or call (817) 439-9009. HomeSafe holds Texas Electrical Contractor License #41809 and has a 5.0 rating across 200+ Google reviews.